Written by Clair Castle, Dr Kim Clugston, Dr Lutfi Bin Othman, Dr Agustina Martínez-García.
How the ‘second life’ of datasets is impacting the research world. Researchers share their stories.
“Research data is the evidence that underpins all research findings. It’s important across disciplines: arts, humanities, social sciences, and STEMM. Preserving and sharing datasets, through Apollo, advances knowledge across research, not only in Cambridge, but across the world – furthering Cambridge’s mission for society and our mission as a national research library.”
Dr Jessica Gardner, University Librarian & Director of Library Services
The research data produced and collected during research takes many different forms: numerical data, digital images, sound recordings, films, interview transcripts, survey data, artworks, texts, musical scores, maps, and fieldwork observations. Apollo collects them all.
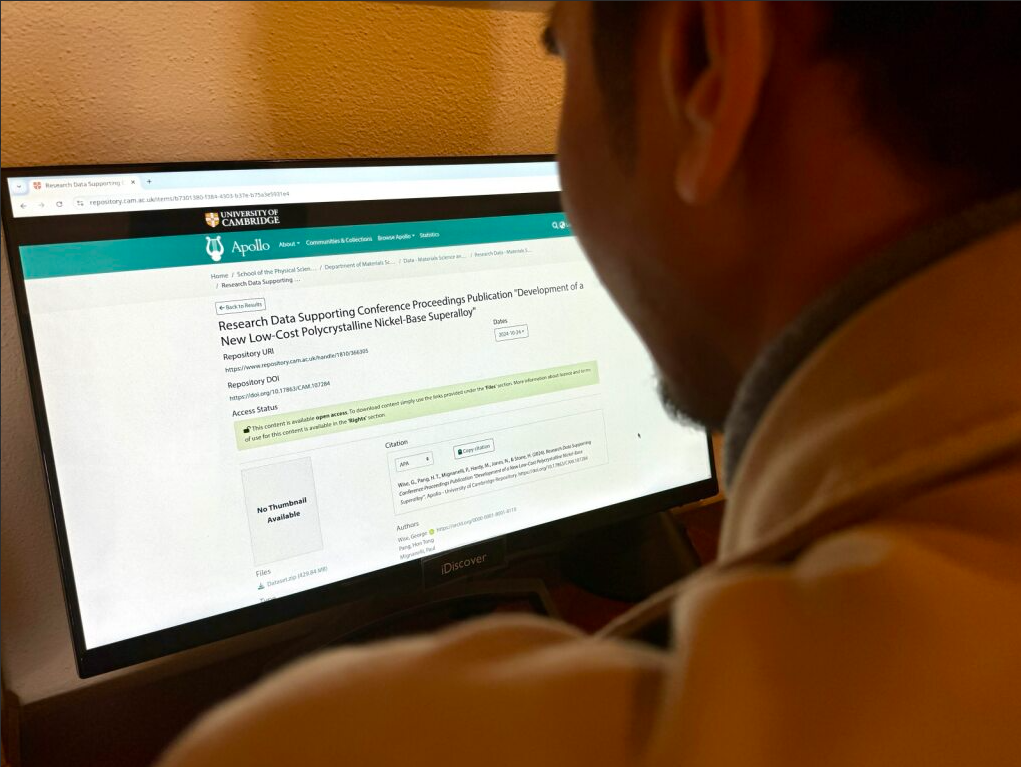
Apollo is the University of Cambridge repository for research datasets. Managed by the Research Data team at Cambridge University Library, Apollo stores and preserves the University’s research outputs.
The Research Data team guides researchers through all aspects of research data management – how to plan, create, organise, curate and share research materials, whatever form they take – and assists researchers in meeting funders’ expectations and good research practice.
In this blog post, upon reaching our 5000 datasets milestone, we share researcher stories about the impact their datasets have had, and continue to have, across research – and explain how researchers at the University can benefit from depositing their datasets on Apollo.
“Sharing data propels research forward. It recognises the importance of the original datasets in their own right, and the researchers who worked on them. Many of the research funders, supporting work at the University of Cambridge, require that research data is made openly available with as few restrictions as possible. Our researchers are fully supported to do this with Apollo and the Research Data team. I’m really excited that Apollo has reached the 5000 dataset milestone.”
Professor Sir John Aston, Pro Vice-Chancellor for Research at the University of Cambridge
Why should researchers share their research outputs on a repository?
Making research data openly available is recognised as an important aspect of research integrity and in recent years has garnered support from funders, publishers and researchers. Open data supports the FAIR principles and many funders now include data sharing practices within their policies as part of the application process. Publishers and funders often require a data availability statement (DAS) to be included in publications. It is worth mentioning (including in a DAS) that there are situations where data cannot be shared, particularly if data contains personal or sensitive information or where there is no permission to share it. But a lot of data can be shared and this movement towards open data promotes greater trust, both among researchers and for engagement with the general public.

In the UK, funding bodies often mandate openly sharing the data supporting their research grants. A large proportion of funding for research is from taxpayers’ money or charity donations so making data available openly for reuse provides value for money. It also allows the data behind claims to be accessed for traceability, transparency and reproducibility. Open data increases efficiency, as it prevents work being repeated that may have already been done; for this reason, it is encouraged to publish negative results too. Publishing data gives researchers credit for the work they have done, giving them more visibility in their field, and increasing the discoverability of their research which could lead to potential collaborations and increased citations. Open data also means that researchers have access to valuable datasets that could educate, enhance and further their research when applied by practitioners worldwide.
The second life of data
Apollo supports data from all disciplines, and this is represented by the various formats that the repository holds in its collection – from movie files, images, audio recordings, or code, to the more common text and CSV files. The repository now also hosts methods. Researchers are encouraged to deposit these outputs onto the repository to facilitate the impact and re-use of data underlying their research, so that their research data can be cited as a form of scholarly output in their own right. In 2023, there were over 95,000 views of datasets and software and associated metadata items on Apollo, and over 37,000 files were downloaded (source: IRUS). This proves that datasets and software deposited on Apollo are easy to discover and are highly used.
One example is a dataset deposited by Douglas Brion at the end of his PhD in the Engineering department. Brion’s dataset, titled Data set for “Generalisable 3D printing error detection and correction via multi-head neural networks” has been downloaded 2,600 times. This dataset has also been featured in 20 online news publications (including in the University’s Research blog) and has an Altmetric attention score of 151. Brion’s dataset is also one of the larger outputs on Apollo, comprising over 1.2 million labelled images and over 900,000 pre-filtered images.
The open availability of Brion’s data that can be used to train AI (a significant trajectory for research currently) is welcomed by researchers such as AI specialist Bill Marino, a PhD candidate and Data Champion from the Department of Computer Science and Technology: “It’s really important that AI researchers are able to reproduce each other’s findings. The opaque nature of some of today’s AI models means that access to data is a key ingredient of AI reproducibility. This effort really helps get us there.”
Brion considers that sharing his data “has significantly enhanced the impact and reach” of his research and that “it has increased the visibility and credibility of my work, as other scientists can validate and build upon my findings.” On the benefits of depositing data on a repository, he says that sharing “ensures that the data is preserved and accessible for the long term, which is crucial for reproducibility and transparency in research”. He adds, “Repositories often provide metadata and tools that make it easier for other researchers to find and use the data”, which “promotes a culture of openness and collaboration, which can accelerate scientific discovery and innovation.”
Research data supporting “Regime transitions and energetics of sustained stratified shear flows” is a dataset from another depositor, Adrien Lefauve, from the Department of Applied Mathematics and Theoretical Physics and consists of MATLAB codes and accompanying movies files. Lefauve is, in fact, a frequent dataset depositor with 10 datasets published in Apollo. He considers that data sharing gives his data “a second life” by allowing researchers to reuse his data in pursuit of new projects but admits that “there is also a selfish reason for doing it!”. He explains that “After several months or years without having worked on a dataset, I sometimes need to go back to it, either by myself or when I hand it over to a colleague or student to test new ideas. Having a well-structured, user-friendly and thoroughly documented dataset is invaluable and will save you a lot of time and frustration when you need to resurrect your own research.”
Lefauve’s dataset has been cited in other publications and he encourages other researchers to look at his datasets and reuse them: “When people see that datasets can be cited in their own right and attract citations, it can encourage them to make the extra effort to deposit their data”. Lefauve is an advocate for sharing data on a repository and in his view data sharing is: “not only important for research integrity and reproducibility, but it also ensures that research funds are used efficiently. My datasets are usually from laboratory experiments which can take a lot of time and resources to perform. Hence, I feel there is a duty to ensure the data can be used to the fullest by the community. It also helps build a researcher’s profile and credentials as a valuable contributor to the community, beyond simply publication output, which often only use a small fraction of a dataset.”
Lefauve describes his field (fluid mechanics) as one that has benefited from the explosion of open data that is made available to the research community, but he is also aware that for a dataset to be reused, it requires comprehensive documentation and curation. Lefauve hopes that sharing data in a repository “will become increasingly commonplace as the next generation is taught that this is an essential part of data-intensive research.”
How to deposit data on Apollo, and why choose Apollo
There are thousands of data repositories to submit data to, so how to choose the right one? Funders may specify a disciplinary or institutional repository (see re3data.org for a directory of all repositories). Members of the University of Cambridge can deposit their data on the institutional repository, Apollo. Apollo has CoreTrustSeal certification, which means it has met the 16 requirements to be a sustainable and trustworthy infrastructure. Research outputs can be deposited as several types, such as dataset, code or method.
We have a step by step guide to uploading a dataset, which is submitted through Symplectic Elements, the University’s research information management system. There is also a helpful information guide about Symplectic Elements on the Research Information Sharepoint site. The Research Data team are on hand to help researchers with any queries they might have during this process.

The importance of good metadata

Researchers may think that the files are the most important aspect when depositing a dataset, but we cannot emphasise enough the importance of providing good metadata (data about data) to go alongside the files. This is the area that we find researchers need some encouragement with, but we hope that the experiences of the researchers we have featured above highlight the importance that good metadata has for their data. No one knows their data better than the person who generated it, so they are in the best position to describe it. A good description of a dataset enables users with no prior knowledge about the dataset to be able to discover, understand and reuse the data correctly, avoiding misinterpretation, without having access to the paper it supports. Be aware that others may discover datasets in isolation from a paper that it supports: we recommend that researchers avoid referring to the paper or using the abstract of the paper to describe their dataset. An article abstract describes the contents of the article, not of the dataset. It can also be really useful for researchers to describe their methods and how their files are organised for example, by providing README files. These give the dataset context as to how the data was generated, collected and processed. Good metadata will also enhance a dataset’s discoverability.
Another benefit of sharing data on Apollo is that our datasets are indexed on Google’s Dataset Search, a search engine for datasets. It is best practice to cite any datasets used in research in the bibliography/reference list of the paper, thesis etc. In fact, there is new guidance for Data Reuse on the Apollo website which describes how to use Apollo to discover research data and how to cite it. We advise that researchers start doing this now (if they don’t already) so they get into a good habit: it will encourage others to do the same and make it a lot easier for others to reuse data and for researchers to receive recognition for it. Citation data for datasets are displayed on Apollo and alongside this it is possible to track the attention that a dataset receives via an Altmetric Attention Score.
Apollo repository key milestones

Since its inception in 2016, when it started minting DOIs (Digital Object Identifiers), Apollo has continued to hit milestones and develop into the robust, safe and resilient repository infrastructure that it is today.
Apollo has continued to support FAIR principles by incorporating new and critical functionality to further enhance discovery, access and long-term preservation of the University research outputs it holds. For example, integration with our CRIS (Current Research Information System), Symplectic Elements, to streamline the depositing process, and integration with JISC Publications Router to automatically deposit metadata-rich records in Apollo (2016, 2019, 2021).
2000 datasets were deposited in Apollo by 2020. DOI versioning was enabled in 2023, as well as accepting more research output types than ever before, such as methods and pre-prints. A major milestone was hit in 2023 when Apollo achieved CoreTrustSeal certification and status as a trustworthy repository.
The latest milestone will be for research outputs published within Octopus, a novel approach to publication, to be preserved together with associated publications and underpinning research datasets in Apollo to facilitate sharing and re-use (2024-25). In future we want to develop our ability to collect and interpret data citation statistics for Apollo so we can better assess the impact of the research data generated at the University.
How we can support researchers
The Research Data team is here to help!
We can be contacted by email at info@data.cam.ac.uk. Researchers can also request a consultation with us to discuss any aspect of their research data management (RDM) needs, including data management plans, data storage and backup, data organisation, data deposition and sharing, funder data policies, or to request bespoke training.
Remember that there is also an amazing network of Data Champions that can be called upon for advice, particularly from a disciplinary perspective.
We deliver regular RDM training as part of the Research Skills Programme.
Finally, there is our Research Data website for comprehensive advice and information.