Tag Archives: altmetrics

What do you want, and why do you want it? An update on Request a Copy

 As part of Open Access Week 2018, the Office of Scholarly Communication is publishing a series of blog posts on open access and open research. In this post Dr Mélodie Garnier provides some new insights into our Request a Copy service.

4,416. This is the number of requests for copies of material in our repository we’ve received over the past 12 months. Daunting, isn’t it? And definitely on the rise, with a 33% increase from the previous year. Two years and a half after its implementation in June 2016, our Request a Copy service is now more popular than ever. Our institutional repository Apollo hosts thousands of freely available research outputs, but also many that are under embargo.  People from all over the world and from all walks of life are keen to access them. But what exactly do requesters want? And why do they want it?

What do people want?

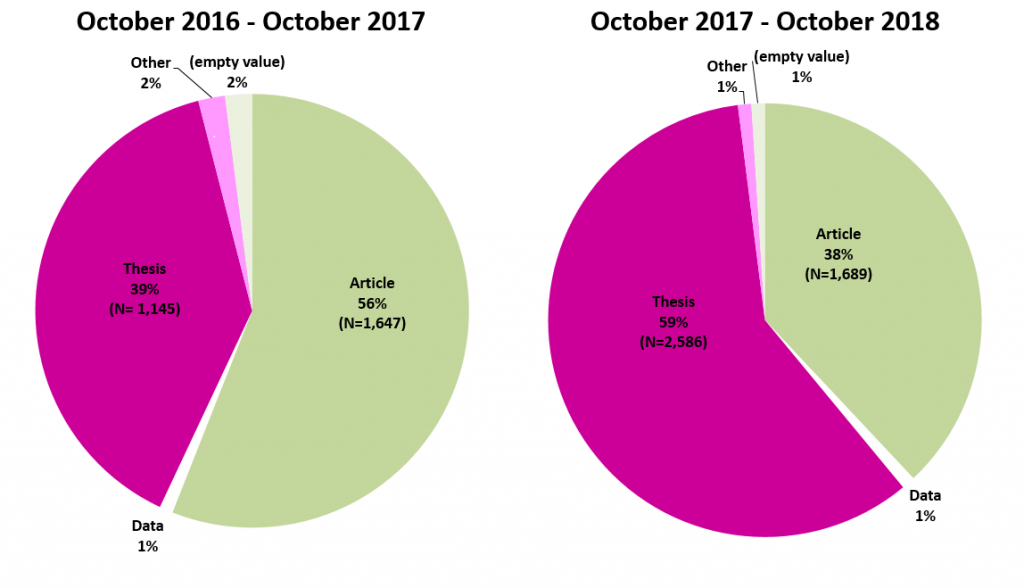
Our repository hosts a whole range of research outputs, but theses and journal articles are by far the most popular. Interestingly, the relative proportion of requested theses vs requested articles has shifted this year. From October 2016 to October 2017, requests for journal articles made up 56% of the total number of requests, and requests for theses made up 39%. Since last October, requests for journal articles have accounted for 38% of the total while theses have accounted for 59%.

Looking at the raw figures, the number of requests for journal articles has actually gone up (from 1,647 to 1,689), though only slightly. But the number of thesis requests has more than doubled, going from 1,145 to 2,586. This is partly explained by the University of Cambridge’s requirement for PhD students to upload their theses from 1st October 2017, leading to 1,279 new theses uploads. On top of these, we have added around 1,300 historical British Library theses and around 200 scanned historical theses from the Digital Content Unit. So between 2,500 and 3,000 theses have been added to Apollo this year alone (more on this tomorrow for #ThesisThursday).

Most wanted

Most items requested this year were only requested once, but 28 items were requested 10 times or more. Of the 20 most requested items, four are journal articles and 16 are PhD theses. Here’s our top 5:

Aside from the gold medal winner, all the other works were published this year and have only been available in Apollo for a few months. So it is striking to see how popular some of them have become in quite a short period of time. A case in point is the zoology article, which was deposited in Apollo only last month and first published shortly afterwards.

Word of mouth

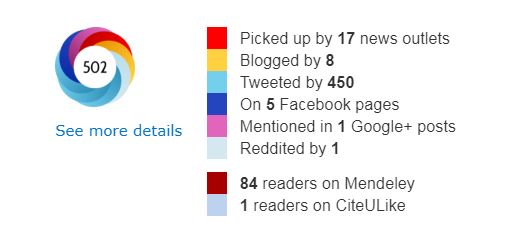
Though it is sometimes unclear why particular outputs suddenly attract a lot of requests, Altmetric Attention scores can be telling – see the one below for the zoology article I’ve just mentioned:

Another interesting example (not included in the top 5) is a PhD thesis deposited in Apollo at the end of August. From 18 in September, the Apollo record has gone up to an astounding number of 911 visits in October (and counting), with a surge of requests. What happened in between? The author publicised her thesis on a Facebook society page, pointing to the repository record link for access.

We only became aware of this as requesters explicitly referred to that page, but it’s possible that similar things happen a lot of the time. So aside from traditional media outlets, the influence of social media on number of requests received can be quite dramatic, and probably greater than we could ever capture.

Tell us about yourself

When requesting a copy of an embargoed article or thesis, people are prompted to leave a message alongside contact details. This is so they can introduce themselves and explain why they are interested in accessing the work, mainly so that authors can make informed decisions on whether to accept or reject requests. Quite often these messages have little to no useful information, but some can be informative in a number of ways.

Through them we can get a glimpse of the range of people accessing the repository – their geographical provenance, background and professional occupation. We can also get a sense of the range of interests that people have (which may appear very specialised, if not a little obscure). And crucially they tell us what people want to do with the research – whether use it as reference, apply it in their professional sphere or simply read it for pleasure.

Why do people request work?

Broadly speaking, people request work in Apollo for the following purposes: reference/citation, personal interest/leisure, replication of results for research purposes, and need to inform professional practice. But those broad categories can include several sub-categories, for example personal interest can stem from hearing about the research in the media or knowing the author.

Getting the full detailed account of why people request work from our repository would require going through messages individually, and perhaps some degree of subjective judgement. Since launching the Request a Copy service we’ve had over 8,000 requests – so even if uninformative messages were excluded, the analysis could be fairly time-consuming. But certainly worth exploring, so watch this space.

Just a snippet…

What better way to advocate for Open Access than to show concrete examples of how research can impact on individual lives? Our Open Access team sees evidence of this every day through Request a Copy messages. So until we can offer a full-blown analysis of the output, let’s conclude this blog post with a selection of favourites:

  • “Our daughter is being investigated for Beckwith Wiedemann Syndrome. We would like as much information as possible about this area”
  • “I’m a pediatric radiation oncologist and this paper is a “practice changer” one!”
  • “My task is to convince policy makers in Sri Lanka to switch to circular economy. I am looking for all possible information to do this”
  • “I work in FE/HE and have a number of students experiencing/ or diagnosed with psychosis, I am very interested in intervention research and programmes for psychosis that can be implemented within our college environment”
  • “I would like a copy of this material for inspiring my high school students of physics”
  • “I hope to learn more about the potential risks of my decision to donate a kidney”

Although there is a definite cost to running Request a Copy in terms of staff time, it is clear how popular and valuable a service it has become. As its popularity increases so does the need for process efficiency, however. This is currently a big priority for us and something we’ll have to keep working on, but we think the benefits for researchers and the wider community are worth it.
Published 24 October 2018
Written by Dr Mélodie Garnier
Creative Commons License

Walking the talk- reflections on working ‘openly’

As part of Open Access Week 2016, the Office of Scholarly Communication is publishing a series of blog posts on open access and open research. In this post Dr Lauren Cadwallader discusses her experience of researching openly.

Earlier this year I was awarded the first Altmetric.com Annual Research grant to carry out a proof-of-concept study looking at using altmetrics as a way of identifying journal articles that eventually get included into a policy document. As part of the grant condition I am required to share this work openly. “No problem!” I thought, “My job is all about being open. I know exactly what to do.”

However, it’s been several years since I last carried out an academic research project and my previous work was carried out with no idea of the concept of open research (although I’m now sharing lots of it here!). Throughout my project I kept a diary documenting my reflections on being open (and researching in general) – mainly the mistakes I made along the way and the lessons I learnt. This blog summarises those lessons.

To begin at the beginning

I carried out a PhD at Cambridge not really aware of scholarly best practice. The Office of Scholarly Communication didn’t exist. There wasn’t anyone to tell me that I should share my data. My funder didn’t have any open research related policies. So I didn’t share because I didn’t know I could, or should, or why I would want to.

I recently attended The Data Dialogue conference and was inspired to hear many of the talks about open data but also realised that although I know some of the pitfalls researchers fall into I don’t quite feel equipped to carry out a project and have perfectly open and transparent methods and data at the end. Of course, if I’d been smart enough to attend an RDM workshop before starting my project I wouldn’t feel like this!

My PhD supervisor and the fieldwork I carried out had instilled in me some practices that are useful to carrying out open research:.

Lesson #1. Never touch your raw data files

This is something I learnt from my PhD and found easy to apply here. Altmetric.com sent me the data I requested for my project and I immediately saved it as the raw file and saved another version as my working file. That made it easy when I came to share my files in the repository as I could include the raw and edited data. Big tick for being open.

Getting dirty with the data

Lesson #2. Record everything you do

Another thing I was told to do during my PhD lab work was to record everything you do. And that is all well and good in the lab or the field but what about when you are playing with your data? I found I started cleaning up the spreadsheet Altmetric.com sent and I went from having 36 columns to just 12 but I hadn’t documented my reasons for excluding large swathes of data. So I took a step back and filled out my project notebook explaining my rationale. Documenting every decision at the time felt a little bit like overkill but if I need to articulate my decisions for excluding data from my analysis in the future (e.g. during peer review) then it would be helpful to know what I based my reasoning on.

Lesson #3. Date things. Actually, date everything

I’d been typing up my notes about why some data is excluded and others not so it informs my final data selection and I’d noticed that I’d been making decisions and notes as I go along but not recording when. If I’m trying to unpick my logic at a later date it is helpful if I know when I made a decision. Which decision came first? Did I have all my ‘bright ideas’ on the same day and now the reason they don’t look so bright is was because I was sleep deprived (or hungover in the case of my student days) and not thinking straight. Recording dates is actually another trick I learnt as a student – data errors can be picked up as lab or fieldwork errors if you can work back and see what you did when – but have forgotten to apply thus far. In fact, it was only at this point that I began dating my diary entries…

Lesson #4. A tidy desk(top) is a tidy mind

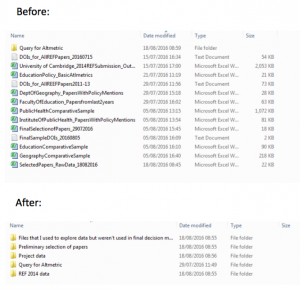
Screen Shot 2016-10-24 at 13.21.11I was working on this project just one day a week over the summer so every week I was having to refresh my mind as to where I stopped the week before and what my plans were that week. I was, of course, now making copious notes about my plans and dating decisions so this was relatively easy. However, upon returning from a week’s holiday, I opened my data files folder and was greeted by 10 different spreadsheets and a few other files. It took me a few moments to work out which files I needed to work on, which made me realise I needed to do some housekeeping.

Aside from making life easier now, it will make the final write up and sharing easier if I can find things and find the correct version. So I went from messy computer to tidy computer and could get back to concentrating on my analysis rather than worrying if I was looking at the right spreadsheet.


Lesson #5. Version control

One morning I had been working on my data adding in information from other sources and everything was going swimmingly when I realised that I hadn’t included all of my columns in my filters and now my data was all messed up. To avoid weeping in my office I went for a cup of tea and a biscuit.

Upon returning to my desk I crossed my fingers and managed to recover an earlier version of my spreadsheet using a handy tip I’d found online. Phew! I then repeated my morning’s work. Sigh. But at least my data was once again correct. Instead of relying on handy tips discovered by frantic Googling, just use version control. Archive your files periodically and start working on a new version. Tea and biscuits cannot solve everything.

Getting it into the Open

After a couple more weeks of problem free analysis it was time to present my work as a poster at the 3:AM Altmetrics conference. I’ve made posters before so that was easy. It then dawned on me at about 3pm the day I needed to finish the poster that perhaps I should share a link to my data. Cue a brief episode of swearing before realising I sit 15ft away from our Research Data Advisor and she would help me out! After filling out the data upload form for our institutional repository to get a placeholder record and therefore DOI for my data, I set to work making my spreadsheet presentable.

Lesson #6. Making your data presentable can be hard work if you are not prepared

I only have a small data set but it took me a lot longer than I thought it would to make it sharable. Part of me was tempted just to share the very basic data I was using (the raw file from Altmetric.com plus some extra information I had added) but that is not being open to reproducibility. People need to be able to see my workings so I persevered.

I’d labelled the individual sheets and the columns within those sheets in a way that was intelligible to me but not necessarily to other people so they all needed renaming. Then I had to tidy up all the little notes I’d made in cells and put those into a Read Me file to explain some things. And then I had to actually write the Read Me file and work out the best format for it (a neutral text file or pdf is best).

I thought I was finished but as our Research Data Advisor pointed out, my spreadsheets were returning a lot of errors because of the formula I was using (it was taking issue with me asking it to divide something by 0) and that I should share one file that included the formulae and one with just the numbers.

If I’d had time, I would have gone for a cup of tea and a biscuit to avoid weeping in the office but I didn’t have time for tea or weeping. Actually producing a spreadsheet without formulae turned out to be simple once I’d Googled how to do it and then my data files were complete. All I then needed to do was send them to the Data team and upload a pdf of my poster to the repository. Job done! Time to head to the airport for the conference!

Lesson #7. Making your work open is very satisfying.

Just over three weeks have passed since the conference and I’m amazed that already my poster has been viewed on the repository 84 times and my data has been viewed 153 times! Wowzers! That truly is very satisfying and makes me feel that all the effort and emergency cups of tea were worth it. As this was a proof-of-concept study I would be very happy for someone to use my work, although I am planning to keep working on it. Seeing the usage stats of my work and knowing that I have made it open to the best of my ability is really encouraging for the future of this type of research. And of course, when I write these results up with publication in mind it will be as an open access publication.

But first, it’s time for a nice relaxed cup of tea.

Published 25 October 2016
Written by Dr Lauren Cadwallader
Creative Commons License

What is ‘research impact’ in an interconnected world?

Perhaps we should start this discussion with a definition of ‘impact’. The term impact is used by many different groups for different purposes, and much to the chagrin of many researchers it is increasingly a factor in the Higher Education Funding Councils for England’s (HECFE) Research Excellence Framework. HEFCE defined impact as:

‘an effect on, change or benefit to the economy, society, culture, public policy or services, health, the environment or quality of life, beyond academia’.

So we are talking about research that affects change beyond the ivory tower. What follows is a discussion about strengthening the chances of increasing the impact of research.

Is publishing communicating research?

Publishing a paper is not a good way of communicating work. There is some evidence that much published work is not read by anyone other than the reviewers. During an investigation of claims that huge numbers of papers were never cited, Dahlia Remler found that:

  • Medicine  – 12% of articles are not cited
  • Humanities – 82% of articles are not cited – note however that their prestigious research is published in books, however many books are rarely cited too.
  • Natural Sciences – 27% of articles are never cited
  • Social Sciences – 32% of articles are never cited

Hirsch’s 2005 paper: An index to quantify and individual’s scientific research output, proposing the h index – defined as the number of papers with citation number ≥h. So an h index of 5 means the author has at least 5 papers with at least 5 citations. Hirsch suggested this as a way to characterise the scientific output of researchers. He noted that after 20 years of scientific activity, an h index of 20 is a ‘successful scientist’. When you think about it, 20 other researchers are not that many people who found the work useful. And that ignores those people who are not ‘successful’ scientists who are, regardless, continuing to publish.

Making the work open access is not necessarily enough

Open access is the term used for making the contents of research papers publicly available – either by publishing them in an open access journal or by placing a copy of the work in a subject or institutional repository. There is more information about open access here.

I am a passionate supporter of open access. It breaks down cost barriers to people around the world, allowing a much greater exposure of publicly funded research. There is also considerable evidence showing that making work open access increases citations.

But is making the work open access enough? Is a 9.5MB pdf downloadable onto a telephone, or through a dail-up connection?  If the download fails at 90% you get nothing. Some publishing endeavours have recogised this as an issue, such as the Journal of Humanitarian Engineering (JHE), which won the Australian Open Access Support Group‘s 2013 Open Access Champion award for their approach to accessibility.

Language issues

The primary issue, however is the problem of understandability. Scientific and academic papers have become increasingly impenetrable as time has progressed. It’s hard to believe now that at the turn of last century scientific articles had the same readability as the New York Times.

‘This bad writing is highly educated’ is a killer sentence from Michael Billig’s well researched and written book ‘Learn to Write Badly: How to Succeed in the Social Sciences‘.  This phenomenon is not restricted to the social sciences, specialisation and a need to pull together with other members of one’s ‘tribe‘ mean that academics increasingly write in jargon and specialised language that bears little resemblance to the vernacular.

There are increasing arguments for scientific communication to the public being part of formal training. In a previous role I was involved in such a program through the Australian National Centre for the Public Awareness of Science. Certainly the opportunities for PhD students to share their work more openly have never been more plentiful. There are many three minute thesis competitions around the world. Earlier this year the British Library held a #Share your thesis competition where entrants were first asked to tweet why their PhD research is/was important using the hashtag #ShareMyThesis. The eight shortlisted entrants were asked to write a short article (up to 600 words) elaborating on their tweet and explaining why their PhD research is/was important  in an engaging and jargon-free way.

Explaining work in understandable language is not ‘dumbing it down’.  It is simply translating it into a different language. And students are not restricted to the written word. In November the eighth winner of the annual ‘Dance your PhD‘ competition sponsored by Science, Highwire Press and the AAAS will be announced.

Other benefits

There is a flow-on effect from communicating research in understandable language. In September, the Times Higher Education recently published an article ‘Top tips for finding a permanent academic job‘ where the information can be summarised as ‘communicate more’.

The Thinkable.org group’s aim is to widen the reach and impact of research projects using short videos (three minutes or less). The goal of the video is to engage the research with a wide audience. The Thinkable Open Innovation Award is a research grant that is open to all researchers in any field around the world and awarded openly by allowing Thinkable researchers and members to vote on their favourite idea. The winner of the award receives $5000 to help fund their research. This is specifically the antithesis of the usual research grant process where grants “are either restricted by geography or field, and selected via hidden panels behind closed doors”.

But the benefit is more than the prize money. This entry from a young Uni of Manchester PhD biomedical student did not win, but thousands of people engaged in her work in just few weeks of voting.

Right. Got the message. So what do I need to do?

Researcher Mike Taylor pulled together a list of 20 things a researcher needs to do when they publish a paper.  On top of putting a copy of the paper in an institutional or subject repository, suggestions include using various general social media platforms such as Twitter and blogs, and also uploading to academic platforms.

The 101 Innovations in Scholarly Communication research project run from the University of Utrecht is attempting to determine scholarly use of  communication tools. They are analysing the different tools that researchers are using through the different phases of the research lifecycle – Discovery, Analysis, Writing, Publication, Outreach and Assessment through a worldwide survey of researchers. Cambridge scholars can use a dedicated link to the survey.

There are a plethora of scholarly peer networks which all work in slightly different ways and have slightly different foci.  You can display your research into your Google Scholar or CarbonMade profile. You can collate the research you are finding into Mendeley or Zotero. You can also create an environment for academic discourse or job searching with Academia.edu, ResearchGate and LinkedIn. Other systems include Publons – a tool to register peer reviewing activity.

Publishing platforms include blogging (as evidenced here), Slideshare, Twitter, figshare, Buzzfeed. Remember, this is not about broadcasting. Successful communicators interact.

Managing an online presence

Kelli Marshall from DePaul University asks ‘how might academics—particularly those without tenure, published books, or established freelance gigs—avoid having their digital identities taken over by the negative or the uncharacteristic?’

She notes that as an academic or would-be academic, you need to take control of your public persona and then take steps to build and maintain it. If you do not have a clear online presence, you are allowing Google, Yahoo, and Bing to create your identity for you. There is a risk that the strongest ‘voices’ will be ones from websites such as Rate My Professors.

Digital footprint

Many researchers belong to an institution,  a discipline and a profession. If these change your online identity associated with them will also change. What is your long term strategy? One thing to consider is obtaining a persistent unique identifier such as an ORCID – which is linked to you and not your institution.

When you leave an institution, you not only lose access to the subscriptions the library has paid for, you also lose your email address. This can be a serious challenge when your online presence in academic social media sites like Academia.edu and ResearchGate are linked to that email address. What about content in a specific institutional repository? Brian Kelly discussed these issues at a recent conference.

We seem to have drifted a long way from impact?

The thing is that if it can be measured it will be. And digital activity is fairly easily measured. There are systems in place now to look at this kind of activity. Altmetrics.org moves beyond the traditional academic internal measures of peer review, Journal Impact Factor (JIF) and the H-index. There are many issues with the JIF, not least that it measures the vessel, not the contents. For these reasons there are now arguments such as the San Francisco Declaration on Research Assessment (DORA) which calls for the scrapping of the JIF to assess a researcher’s performance. Altmetrics.org measures the article itself, not where it is published. And it measures the activity of the articles beyond academic borders. To where the impact is occurring.

So if you are serious about being a successful academic who wants to have high impact, managing your online presence is indeed a necessary ongoing commitment.

NOTE: On 26 September, Dr Danny Kingsley spoke on this topic to the Cambridge University Alumni festival. The slides are available in Slideshare. The Twitter discussion is here.

Published 25 September 2015
Written by Dr Danny Kingsley
Creative Commons License