As part of Open Access Week 2016, the Office of Scholarly Communication is publishing a series of blog posts on open access and open research. In this post Dr Lauren Cadwallader discusses her experience of researching openly.
Earlier this year I was awarded the first Altmetric.com Annual Research grant to carry out a proof-of-concept study looking at using altmetrics as a way of identifying journal articles that eventually get included into a policy document. As part of the grant condition I am required to share this work openly. “No problem!” I thought, “My job is all about being open. I know exactly what to do.”
However, it’s been several years since I last carried out an academic research project and my previous work was carried out with no idea of the concept of open research (although I’m now sharing lots of it here!). Throughout my project I kept a diary documenting my reflections on being open (and researching in general) – mainly the mistakes I made along the way and the lessons I learnt. This blog summarises those lessons.
To begin at the beginning
I carried out a PhD at Cambridge not really aware of scholarly best practice. The Office of Scholarly Communication didn’t exist. There wasn’t anyone to tell me that I should share my data. My funder didn’t have any open research related policies. So I didn’t share because I didn’t know I could, or should, or why I would want to.
I recently attended The Data Dialogue conference and was inspired to hear many of the talks about open data but also realised that although I know some of the pitfalls researchers fall into I don’t quite feel equipped to carry out a project and have perfectly open and transparent methods and data at the end. Of course, if I’d been smart enough to attend an RDM workshop before starting my project I wouldn’t feel like this!
My PhD supervisor and the fieldwork I carried out had instilled in me some practices that are useful to carrying out open research:.
Lesson #1. Never touch your raw data files
This is something I learnt from my PhD and found easy to apply here. Altmetric.com sent me the data I requested for my project and I immediately saved it as the raw file and saved another version as my working file. That made it easy when I came to share my files in the repository as I could include the raw and edited data. Big tick for being open.
Getting dirty with the data
Lesson #2. Record everything you do
Another thing I was told to do during my PhD lab work was to record everything you do. And that is all well and good in the lab or the field but what about when you are playing with your data? I found I started cleaning up the spreadsheet Altmetric.com sent and I went from having 36 columns to just 12 but I hadn’t documented my reasons for excluding large swathes of data. So I took a step back and filled out my project notebook explaining my rationale. Documenting every decision at the time felt a little bit like overkill but if I need to articulate my decisions for excluding data from my analysis in the future (e.g. during peer review) then it would be helpful to know what I based my reasoning on.
Lesson #3. Date things. Actually, date everything
I’d been typing up my notes about why some data is excluded and others not so it informs my final data selection and I’d noticed that I’d been making decisions and notes as I go along but not recording when. If I’m trying to unpick my logic at a later date it is helpful if I know when I made a decision. Which decision came first? Did I have all my ‘bright ideas’ on the same day and now the reason they don’t look so bright is was because I was sleep deprived (or hungover in the case of my student days) and not thinking straight. Recording dates is actually another trick I learnt as a student – data errors can be picked up as lab or fieldwork errors if you can work back and see what you did when – but have forgotten to apply thus far. In fact, it was only at this point that I began dating my diary entries…
Lesson #4. A tidy desk(top) is a tidy mind
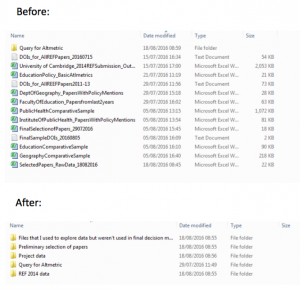 I was working on this project just one day a week over the summer so every week I was having to refresh my mind as to where I stopped the week before and what my plans were that week. I was, of course, now making copious notes about my plans and dating decisions so this was relatively easy. However, upon returning from a week’s holiday, I opened my data files folder and was greeted by 10 different spreadsheets and a few other files. It took me a few moments to work out which files I needed to work on, which made me realise I needed to do some housekeeping.
Aside from making life easier now, it will make the final write up and sharing easier if I can find things and find the correct version. So I went from messy computer to tidy computer and could get back to concentrating on my analysis rather than worrying if I was looking at the right spreadsheet.
Lesson #5. Version control
One morning I had been working on my data adding in information from other sources and everything was going swimmingly when I realised that I hadn’t included all of my columns in my filters and now my data was all messed up. To avoid weeping in my office I went for a cup of tea and a biscuit.
Upon returning to my desk I crossed my fingers and managed to recover an earlier version of my spreadsheet using a handy tip I’d found online. Phew! I then repeated my morning’s work. Sigh. But at least my data was once again correct. Instead of relying on handy tips discovered by frantic Googling, just use version control. Archive your files periodically and start working on a new version. Tea and biscuits cannot solve everything.
Getting it into the Open
After a couple more weeks of problem free analysis it was time to present my work as a poster at the 3:AM Altmetrics conference. I’ve made posters before so that was easy. It then dawned on me at about 3pm the day I needed to finish the poster that perhaps I should share a link to my data. Cue a brief episode of swearing before realising I sit 15ft away from our Research Data Advisor and she would help me out! After filling out the data upload form for our institutional repository to get a placeholder record and therefore DOI for my data, I set to work making my spreadsheet presentable.
Lesson #6. Making your data presentable can be hard work if you are not prepared
I only have a small data set but it took me a lot longer than I thought it would to make it sharable. Part of me was tempted just to share the very basic data I was using (the raw file from Altmetric.com plus some extra information I had added) but that is not being open to reproducibility. People need to be able to see my workings so I persevered.
I’d labelled the individual sheets and the columns within those sheets in a way that was intelligible to me but not necessarily to other people so they all needed renaming. Then I had to tidy up all the little notes I’d made in cells and put those into a Read Me file to explain some things. And then I had to actually write the Read Me file and work out the best format for it (a neutral text file or pdf is best).
I thought I was finished but as our Research Data Advisor pointed out, my spreadsheets were returning a lot of errors because of the formula I was using (it was taking issue with me asking it to divide something by 0) and that I should share one file that included the formulae and one with just the numbers.
If I’d had time, I would have gone for a cup of tea and a biscuit to avoid weeping in the office but I didn’t have time for tea or weeping. Actually producing a spreadsheet without formulae turned out to be simple once I’d Googled how to do it and then my data files were complete. All I then needed to do was send them to the Data team and upload a pdf of my poster to the repository. Job done! Time to head to the airport for the conference!
Lesson #7. Making your work open is very satisfying.
Just over three weeks have passed since the conference and I’m amazed that already my poster has been viewed on the repository 84 times and my data has been viewed 153 times! Wowzers! That truly is very satisfying and makes me feel that all the effort and emergency cups of tea were worth it. As this was a proof-of-concept study I would be very happy for someone to use my work, although I am planning to keep working on it. Seeing the usage stats of my work and knowing that I have made it open to the best of my ability is really encouraging for the future of this type of research. And of course, when I write these results up with publication in mind it will be as an open access publication.
But first, it’s time for a nice relaxed cup of tea.
Published 25 October 2016
Written by Dr Lauren Cadwallader
