Cambridge’s RCUK/COAF Open Access spend January 2017 – March 2018
It’s been reporting season for institutions in receipt of RCUK Open Access block grant awards, so we’ve been busy preparing data for both RCUK (now UKRI) and Jisc about how Cambridge has spent its funding allocation over the past 15 months (January 2017 – March 2018). In this blog post I’ll focus mainly on the Jisc Open Access article processing charge (APC) report as it includes both RCUK and COAF expenditure, which we’ve made available in Apollo (the RCUK report is available there too). We’ve had to make a few tweaks to the data to perform the analysis that follows, but that shouldn’t substantially affect the figures. Unless stated otherwise, all charges reported include VAT at 20%.
Headlines
Let’s start with a few headline numbers (Table 1). In the reporting period January 2017 – March 2018 the Open Access Team paid Open Access APCs totalling more than £2.8 million. By far the largest beneficiary of this funding was Elsevier, which received over £870,000 for RCUK and COAF funded research articles (that’s 31% of all our APC spend). In fact, Elsevier dominates the figures to such an extent that for this blog post I’ve split Cell Press titles to provide a little more insight.
Table 1. Headline figures between January 2017 and March 2018 for the RCUK and COAF Open Access block grants (https://doi.org/10.17863/CAM.24288).
| Value | Notes | |
| Total spend | £2,989,609.13 | |
| Open Access | £2,847,135.05 | |
| Additional publication costs (mainly page and colour fees) | £111,631.68 | |
| Publisher memberships/deals | £30,842.40 | |
| Articles | 1547 | SCOAP3 papers unknown |
| ‘Other’ Springer Compact articles | 221 | |
| Mean APC (All publishers) | £1,840 | SCOAP3 papers unknown |
| Mean APC (excluding ‘Other’ Springer Compact articles) | £2,147 | SCOAP3 papers unknown |
| Mean APC ± σ (invoiced APCs only) | £2,254 ± 1007 | Excludes SCOAP3, Springer Compact, Wiley prepayment, OUP prepayment |
| Median APC (invoiced APCs only) | £2,042 | Excludes SCOAP3, Springer Compact, Wiley prepayment, OUP prepayment |
That £2.8 million paid for at least 1547 articles. I say ‘at least’ because (i) we haven’t recorded papers funded through the SCOAP3 partnership for which we paid just shy of £25,000; (ii) choosing a precise reporting date is difficult, especially for prepayment deals where invoicing is disconnected from the publishing process; and (iii) we are reporting from specific University cost centres, however, for operational reasons payments may have been taken from other sources making it difficult to ultimately reconcile in a neat report.
But assuming these problems are negligible then the mean APC was £1,840 (which is similar to previous years).
However, there is the complication of the Springer Compact which Cambridge funds through a combination of the RCUK and COAF block grants. If we only consider RCUK/COAF funded papers processed as part of the Springer Compact then the average APC is £1,036, significantly less than Springer’s APC list price of €2,200 +VAT (so it’s a good deal from an RCUK/COAF perspective). However, a majority of Springer Compact papers do not acknowledge RCUK or COAF, and under normal circumstances these papers would not be eligible for Open Access funding. Excluding these 221 ‘other’ Springer Compact papers from the calculations increases the overall mean APC to £2,147. This demonstrates, once again, how progressive the Springer Compact continues to be. We wrote last year about the value to us of the deal. The overall distribution of APCs paid to all publishers is shown in Figure 1.
Figure 1. Distribution of all APCs paid to all publishers (including prepayments to OUP and Wiley). Springer Compact and Wiley credit articles are also shown for completeness.

Level playing field?
Figure 2 and Table 2 give an in-depth breakdown of the APCs paid to publishers for which at least 10 APCs were paid. There are several interesting features to the data. Firstly, the sheer number and spread of APCs paid to Elsevier is immense. While many other publishers have clear pricing bands, Elsevier’s pricing structure exists in a continuum between £500 and £5,000. Elsevier’s mean APC is well above that of the all-publisher mean, though still within one standard deviation. The same cannot be said of Cell Press, which has a mean APC of £4,084 and is the only large publisher more than one standard deviation from the all-publisher mean invoice value. The bulk of their APCs are clustered just below £5000.
Nature Publishing Group’s (NPG) mean APC is somewhat distorted because the majority of APCs are for either Scientific Reports (£1,332) or Nature Communications (£3,780). These journals are also the two most popular with Cambridge authors at 65 and 50 papers respectively, roundly beating third placed Journal of the American Chemical Society which had 24 papers.
Price banding of APCs paid in Pounds Sterling can be seen in a number of other publishers, notably the Royal Society of Chemistry, BioMed Central and BMJ. It is also apparent in some publishers which charge in US Dollars, such as PLOS and the American Chemical Society (ACS), although currency fluctuations mean these APCs have a spread of Sterling values. A cluster of ACS invoices around £500 fall in to two categories (i) CC BY fees and (ii) invoices which had additional discounts applied by ACS (some authors get credits with ACS).
Figure 2. Individual and mean APCs paid to publishers. The mean APC value represents the total paid for these schemes per article processed. The all-publisher mean invoice with one standard deviation is shown for comparison. Standard deviations are not given for Springer Compact, Wiley (prepayment) or OUP (prepayment) because individual invoices are not processed in these cases. APC values for these deals are either based on the mean (Springer Compact) or the nominal APC value if we had been directly invoiced. Click the image to view a larger version.
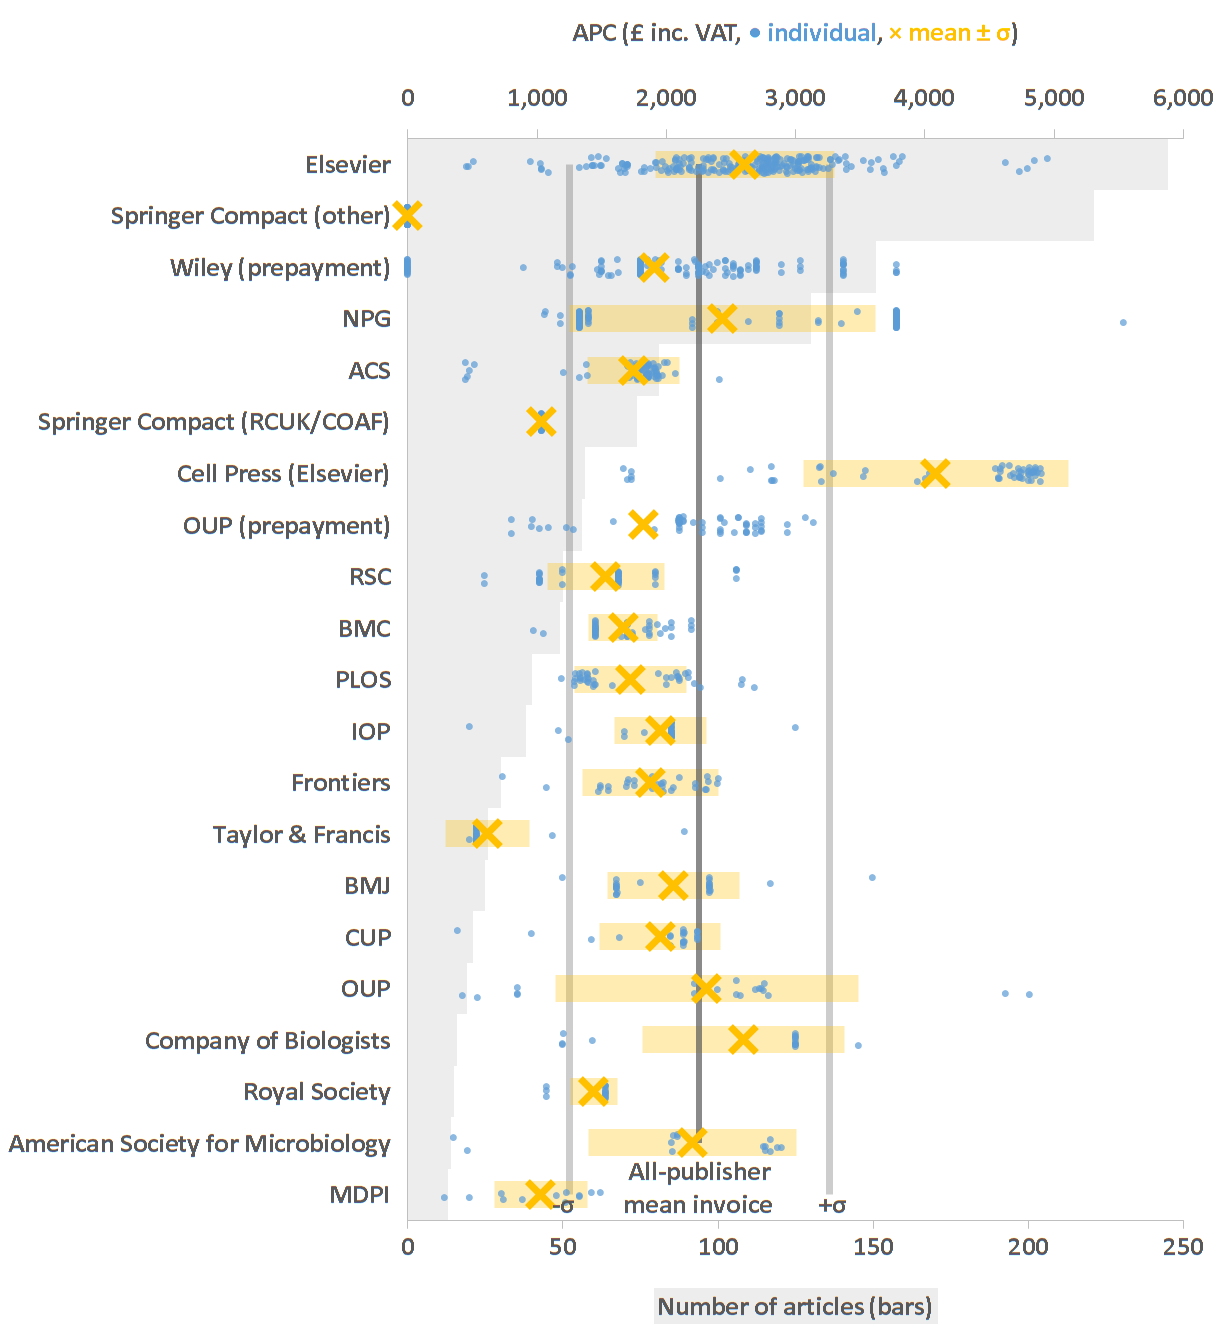
Table 2. Total APC, membership and other publication fees paid to publishers.
| Publisher | Open Access Spend (£) | Articles | Mean APC (£) | σ (£) | Publisher memberships/deals (£) | Additional publication costs (£) | Articles | Mean publication costs (£) |
| Elsevier | 638,833 | 245 | 2,607 | 689 | – | 1,535 | 3 | 512 |
| Springer Compact (other) | – | 221 | – | – | – | – | – | – |
| Wiley (prepayment) | 288,000 | 151 | 1,907 | – | – | 4,509 | 3 | 1,503 |
| NPG | 316,398 | 130 | 2,434 | 1,182 | – | 6,535 | 4 | 1,634 |
| ACS | 141,377 | 81 | 1,745 | 358 | – | 2,694 | 23* | 117 |
| Springer Compact (RCUK/COAF) | 76,700 | 74 | 1,036 | – | – | – | – | – |
| Cell Press (Elsevier) | 232,809 | 57 | 4,084 | 1,024 | – | 21,684 | 11 | 1,971 |
| OUP (prepayment) | 102,000 | 56 | 1,821 | – | – | 960 | 1 | 960 |
| RSC | 76,620 | 50 | 1,532 | 449 | – | – | – | – |
| BMC | 81,708 | 49 | 1,668 | 267 | 10,524 | – | – | – |
| PLOS | 68,989 | 40 | 1,725 | 432 | – | – | – | – |
| IOP | 74,334 | 38 | 1,956 | 354 | – | 1,998 | 2 | 999 |
| Frontiers | 56,359 | 30 | 1,879 | 524 | – | – | – | – |
| Taylor & Francis | 16,090 | 26 | 619 | 326 | – | 1,152 | 2 | 576 |
| BMJ | 51,358 | 25 | 2,054 | 511 | – | 900 | 3 | 300 |
| CUP | 40,991 | 21 | 1,952 | 465 | – | – | – | – |
| OUP | 43,950 | 19 | 2,313 | 1,171 | 2,918 | 6,909 | 5 | 1,382 |
| Company of Biologists | 41,524 | 16 | 2,595 | 782 | – | – | – | – |
| Royal Society | 21,600 | 15 | 1,440 | 180 | 15,000 | – | – | – |
| American Society for Microbiology | 30,827 | 14 | 2,202 | 807 | – | 3,141 | 5 | 628 |
| MDPI | 13,370 | 13 | 1,028 | 360 | – | – | – | – |
*These charges are ACS membership fees, which we pay on behalf of authors because the ACS offers substantial APC discounts to its members.
Page and colour charges
Paling in comparison to APC expenditure, though still a significant sum given that other UK institutions receive less than £10,000 p.a. from RCUK, we supported additional publication costs (mostly page and colour fees) to the value of £111,000. Nearly 20% of this spend went to Cell Press titles with an average article costing £1,971. One has to wonder why publishers continue to charge these sort of publication fees. Fees of this nature are outdated and out of touch, and it is hard to see how they are anything but a cynical attempt at revenue raising.
It is especially galling though when page and colour fees are levied on top of already high APCs. The combined cost to publish a single article in Neuron was £7633.19. Table 3 lists the articles for which we paid over £5000 in either APCs or page and colour charges – I’d encourage you to read them if for no other reason than we get our money’s worth. Together these nine papers represent 1.9% of our total spend, yet only 0.7% of RCUK/COAF funded articles. Cell Press is particularly guilty in this case, making up the bulk of ultra-expensive papers. Indeed, because we don’t routinely pay page and colour charges, it seems highly likely that many page and colour fees will have been paid without our knowledge. We might reasonably assume, therefore, that there are many more ultra-expensive papers that have gone unnoticed in this analysis.
Table 3. Ultra-expensive papers which cost more than £5000 to publish.
| DOI | Publisher | Journal | APC (£) | P&C (£) | Total (£) |
| 10.1016/j.neuron.2017.07.016 | Cell Press (Elsevier) | Neuron | 4808.26 | 2824.93 | 7633.19 |
| 10.1016/j.molcel.2018.01.034 | Cell Press (Elsevier) | Molecular Cell | 4840.19 | 2488.67 | 7328.86 |
| 10.3945/ajcn.116.150094 | Oxford University Press (OUP) | American Journal of Clinical Nutrition | 4626.52 | 2109.7 | 6736.22 |
| 10.1016/j.stem.2018.01.020 | Cell Press (Elsevier) | Cell Stem Cell | 4855.96 | 1807.18 | 6663.14 |
| 10.1016/j.devcel.2017.04.004 | Cell Press (Elsevier) | Developmental Cell | 4552.94 | 2003.28 | 6556.22 |
| 10.1016/j.cub.2017.08.004 | Cell Press (Elsevier) | Current Biology | 4875.32 | 1362.43 | 6237.75 |
| 10.1016/j.cub.2017.01.050 | Cell Press (Elsevier) | Current Biology | 4585.8 | 1285.94 | 5871.74 |
| 10.1038/ncomms16001 | Nature Publishing Group | Nature Communications | 5542.17* | – | 5542.17 |
| 10.1175/BAMS-D-14-00290.1 | American Meteorological Society | Bulletin of the American Meteorological Society | – | 5539.43 | 5539.43 |
*Normally we’d be charged in Pounds Sterling for Nature Communications articles, however, this invoice was received from an international co-author who was charged in US Dollars with an unfavourable exchange rate. At the time the usual charge for Nature Communications was £3150 +VAT. You can see just how much of an outlier this paper is in Figure 2.
The long view
If we look back on the past five years of RCUK expenditure (Table 4) it is clear that after a slow start, the annual expenditure rapidly increased, and now exceeds the annual allocation provided by RCUK. If no controls are placed on expenditure we might expect to overspend in 2018/19 by £400,000. Given the finite block grant, that is something we need to urgently mitigate.
Table 4. Cambridge’s historical RCUK block grant spend over the past five years, with a projection for 2018/19 if no controls are placed on expenditure (https://doi.org/10.17863/CAM.23725).
| OA block grant summary information | OA grant brought forward (£) | OA grant received (£) | OA Grant available (£) | OA grant spent (£) | OA grant carried forward (£) |
| Actual Year 1 spend (April 2013 – March 2014) | 0 | 1,151,812 | 1,151,812 | 471,147 | 680,665 |
| Actual Year 2 spend (April 2014 – March 2015) | 680,665 | 1,355,073 | 2,035,738 | 1,139,480 | 896,258 |
| Actual Year 3 spend (April 2015 – March 2016) | 896,258 | 1,546,388 | 2,442,646 | 1,358,415 | 1,084,232 |
| Actual Year 4 spend (April 2016 – March 2017) | 1,084,232 | 1,269,319 | 2,353,550 | 1,935,379 | 418,172 |
| Actual Year 5 spend (April 2017 – March 2018) | 418,172 | 1,350,225 | 1,768,397 | 1,767,821 | 576 |
| Estimated spend in Year 6 (April 2018 – March 2019) | 576 | 1,362,905 | 1,363,481 | 1,800,000 | -436,519 |
Cambridge has operated a ‘15% rule’ for many years where, because roughly 15% of all publications are in fully OA journals, if block grant funding were to dip to this level the Open Access Team would not pay hybrid APCs so as to ensure authors publishing in fully OA journals would not be left to foot the bill. However, flipping between policies based on the variability of block grant funding causes considerable confusion amongst authors, so a consistent policy implemented with plenty of forewarning would be preferable. Our peers at Oxford and Manchester have already announced policies that restrict the payment of hybrid APCs, and we are considering similar models to rein in our spending. Watch this space.
Published 18 June 2018
Written by Dr Arthur Smith


2 Comments
Pingback:
Pingback: