Clair Castle, Librarian at the Department of Chemistry, describes how during her secondment to the Office of Scholarly Communication (OSC) as Research Data Coordinator, she collaborated with Clare Trowell, Data Champion and Marshall Librarian at the Faculty of Economics, to design some cartoons to use to advocate for the Data Champions Programme.
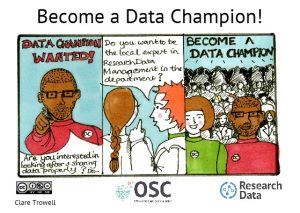 I have been collaborating with the OSC on various RDM (Research Data Management) activities since it was established in 2015. I was fortunate enough to be appointed on secondment to the OSC from May to October 2018, as Research Data Coordinator. One of my main responsibilities was to manage the Data Champions Programme (with which I was already involved in my department).
Data Champions are volunteers who advise members of the research community on proper handling of research data. In this, they promote good research data management (RDM) and support Findable, Accessible, Interoperable, and Re-usable (FAIR) research principles.
Data Champions form a network across different schools and departments of the University of Cambridge as well as affiliated institutes. The Data Champion Programme is open to all University members interested in research data handling, for example researchers (from PhD students to PIs), data managers, IT professionals, librarians, and data scientists.
Demonstrating the value of RDM
The Data Champions have bimonthly Forum meetings where they have the opportunity to hear speakers on RDM related topics, speak about their own RDM activities, and network. At the May 2018 Forum meeting Dr Danny Kingsley (Head of the OSC) led a stakeholder analysis exercise to try and work out: a) why RDM is of value to different stakeholders, b) their possible objections to RDM, and c) what responses a Data Champion could formulate to these objections. The idea being that if a Data Champions was stuck in a lift with one of these stakeholders, or sat next to someone at a college dinner or a meeting for example, and are having a conversation about RDM, and that person raised an objection to it, this could be rebutted with a suitable response prepared in advance.
Stakeholders included were:
- PhD students
- PostDocs
- Early Career Researchers
- Principal Investigators
- Undergraduate students
- Masters students
- University administration (e.g. research grant administrators, librarians)
- University committee structure
- Vice Chancellor
- Funders
- Members of the public.
We were divided into groups, each of which represented a particular stakeholder, and wrote down our thoughts on (a)-(c) as above on post-it notes. Unfortunately we ran out of people to write anything about the members of the public as stakeholders.
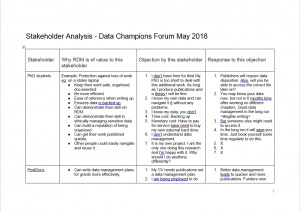 I collated what was written on the post-it notes into a table and this was discussed at the following Data Champions Forum meeting in July. Ideas were invited from everybody about how we should feature this information for best usage and as practical resource for RDM advocacy.
One idea from Dr Lauren Cadwallader (Research Data Facility Manager) was a cartoon design for use on small postcards or on posters and she asked if anyone could draw. It was at this point that Clare Trowell stuck her hand up – as she is also an artist!
Drawing up a plan
One of the main ideas behind the cartoons was that the Research Data Team wanted to create an ‘advocacy’ resource in the Data Champions’ Google Drive. Data Champions could then use them in posters, training sessions etc. that they would design themselves. The first use for the cartoons would be on postcards to promote the Data Champions Programme and the RDM services that the Research Data team offer.
I arranged to meet Clare a couple of times for a cup of tea and a chat about what would be required, and to catch up on progress, and we established the following:
- Timescale – Clare wanted to complete the project by the end of the Summer Vacation due to the term-time commitments there would be at Economics in the Michaelmas Term.
- Licensing – We agreed on the Creative Commons licence CC-BY-NC-ND (which only allows others to download your works and share them with others as long as they credit you, but they can’t change them in any way or use them commercially). Clare wanted to retain her copyright in her cartoons so she could use them for promotion on her personal website. She also wanted to prevent others from profiting from them as she did this work pro bono for the OSC. She was also concerned that without “No Derivatives” it might be possible to make disrespectful adaptations. She is not concerned about profiting from the designs herself.
- Costs – postcards would be free to print by the University Library, where the OSC is based. Clare volunteered her services for free but we did remunerate her for the materials she used. I would be designing the postcard template as part of my usual role.
- Workload – Clare felt that around 8 scenarios would be manageable for her to draw in the time available. I asked her to draw one more that could be specifically used to encourage people to become a Data Champion.
- Cartoon content – we debated whether we should we have 3 or 4 ‘boxes’ in a strip. I would provide text statements for Clare to illustrate. We agreed to use speech bubbles to contain the text, as is traditional with cartoon characters when speaking.
- Stakeholders – which should we focus on? We describe the cartoon characters we finally decided on below. We needed some of the 8 postcards to be appropriate for STEM or HASS disciplines, or both. They should therefore feature a variety of characters that could be used in different situations.
The next step was for me to identify themes from the objections to RDM and the responses to them in the stakeholder analysis exercise and to translate them into scenarios for the cartoons:
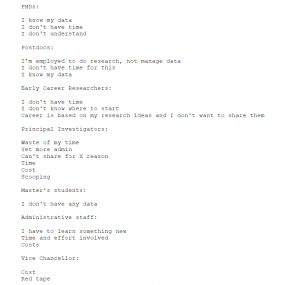 My summary of themes looked like this:
- Fear of being scooped
- Unable to share
- Unwilling to share
- Time and effort
- Cost
- Waste of time
Meet the cast
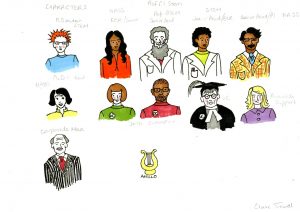 Literally as we were talking, Clare started drawing and we eventually came up with a range of characters that we took from the stakeholder analysis exercise results. We grouped post-docs and early career researchers together, and the PhD and Masters students together, in order to rationalise the numbers involved. We left out undergraduates and funders, as they aren’t a priority for advocacy at the moment. (Please note this image is licensed CCBY-NC-ND, attribution Clare Trowell).
Clare also invented ‘Corporate Man’ (very popular with the Data Champions and the Research Data Team!) and two Data Champion characters. Clare tried very hard to be as diverse as possible, in order to represent the Data Champions inclusively. Her inspiration for the characters has tended to come from real-life people she has encountered.
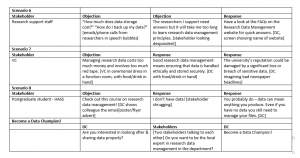 Here are some of the final scenarios I devised for Clare to illustrate. I found it was easier to include just three boxes in a strip – represented above by the number of columns. I had minimal space for text so I needed to be quite concise, as well as having to imagine scenarios that would be immediately understood. This was challenging but really enjoyable. I also received some useful feedback from Danny and Lauren at this stage.
Postcard design
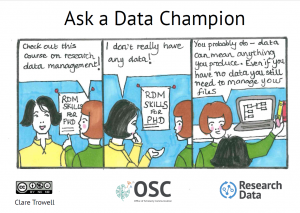 The cartoons were scanned (using a high quality flatbed scanner at Economics) from the hand-drawn originals to create digital images in PDF and TIFF format. These files were too large to send to me by email so Clare made a few trips to the OSC with a memory stick!
I started off designing the postcards in Canva but this has quite a limited editing capacity (especially for cropping and resizing the images) so I moved on to using Inkscape. In contrast to Canva, this is free, open source graphic design software, which other members of the OSC had used previously. It has the advantage that anyone will be able to use this to amend the designs in future. I was given lots of advice and help but I really ended up learning as I went along due to the limited time available – a steep learning curve! Inkscape’s main output is in SVG format but images can be converted to PDF.
The nice thing about hand-drawn cartoons is that they don’t have completely straight lines, but this made it a bit difficult to orientate the drawings on the postcards. I did the best I could but I quite like the ‘hand-made’ feel of the final designs.
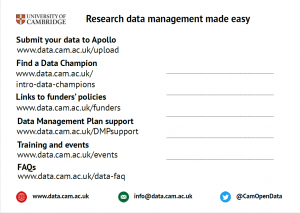
For the content on the reverse of the postcards I updated a version of the current Research Data postcard that the team were giving out at training sessions and other events. This provides links to sources of help and guidance on sharing research data, and to the Research Data Management website and social media accounts. It would now include a link to the Data Champions programme.
Feedback
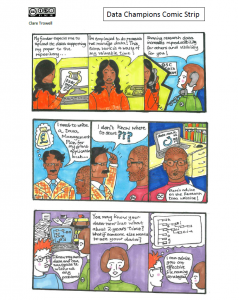 The September Data Champions Forum meeting included a general discussion on the possible branding of the Data Champions programme. As part of this, Clare introduced her cast of characters and I shared a compilation of all the scenarios in a ‘comic strip’.
I also printed off some prototype postcards so that everyone could see what they could look like. The feedback was positive and just a few final tweaks were suggested, including creating more space on the reverse for people to write a message and an address, so it can be actually posted, and adding the headline ‘Ask a Data Champion’.
Cartoons as an advocacy tool
The final designs were just about ready in time for the beginning of the new academic year when we knew Data Champions would be inducting new students and staff and doing RDM training in their institutions. I uploaded the designs to the Data Champions Google Drive, and numbered them from 1-9. Data Champions could then choose which they would like printed copies of and request the designs and amounts required via an online form. We sent them out in the internal post.
The initial print run was 100 of each design, most of which were sent out to Data Champions upon request. We received requests for sometimes a small number of each design or larger numbers of a few designs. We needed to make a further print run of 50 each of a couple of scenarios: “Check out this course on research data management” and the “Data Champion Wanted” designs, as they proved to be particularly popular for use at induction and training events.
The Research Data team now distributes the postcards at all RDM training sessions and, if there is a choice, they are apparently more popular with the usual, more formal research data ones, perhaps because of their more informal nature? I think colourful illustrations of people do tend to stand out more.
At forum meetings we discussed the possibility of using the cartoons in the following contexts:
- Producing short videos that could include role-play.
- Interactive feature on a website (e.g. objections to RDM as a word cloud/speech bubbles, hover over an objection to RDM to see a rebuttal for it)
- Memes on social media.
- Insert postcard in the welcome packs for students or as a flyer, and on Powerpoint slides for use in foyers/on TV screens.
- Using the #askadatachampion Twitter hashtag alongside cartoons.
- Pokemon-like game – collect all the different cards!
- Animation with cartoons, potentially for use on the OSC YouTube channel. See Powtoon and Adobe Character Animator which creates moving images from 2D drawings for ideas.
Outcomes
Cartooning in the world of libraries and publishing is increasing; one example is the cartoon abstract of the Research Support Ambassador programme at Cambridge University paper written by Claire Sewell and Danny Kingsley. As well as drawing the cartoons for the Data Champion postcards, Clare has drawn one for use by the OSC to promote the digitisation of theses at the University. Cartoons and drawings offer an interesting alternative to the traditional, perhaps more formal ways of communicating.
This project has proved to be an innovative and fun way for the Research Data team/the OSC to collaborate with its stakeholders, and to promote the Data Champions programme and theses digitisation. One significant outcome has been the role of the cartoons in the wider discussion of branding by the OSC that followed, and which is ongoing.
There were challenging issues around the technical side of designing the cartoons but this can be improved upon in future. The Data Champions will soon have an impressive set of designs they can use to promote their RDM activities.
I thank Lauren for steering me through the process and her and my OSC colleagues for imparting their Inkscape skills. I also thank Clare for being such a good collaborator and allowing us to use her talents to create these eye-catching postcards.
NOTE: All the cartoons are available on the RDM website.
Published 10 January 2019
Written by Claire Castle, with contribution from Clare Trowell

Dear Claire and Clare,
Terrific work. I love not only the results but also the way it was designed.
I wonder if your analysis is also available for download and whether it is licensed. (BTW, I am looking for arguments related to how rdm does help data analysis…). I would be very happy to add them to https://rdmpromotion.rbind.io, an open source project gathering RDM outreach material.
I am very sad about the license you used, though. The ND means we can not make translations ourselves (without asking first), the NC means that I will not be able to use them in any free-lance workshop and since I am unsure about my non-free lance teaching activity at the university, I will also not use them there (without asking first).
Could you also push the .svg files into Zenodo, it would be great to have them downloadable there (and citable). I suppose you can still mention that the postcards are CC-BY-NC and that only the pictures are ND (?). It would also be great to add a way to contact you to ask permission for modifications and re-use.
If you ever do videos, please add them (also) in a platform where it can be easily downloaded (Figshare, zenodo).
Bravo,
Dr. Julien Colomb
PS: Thanks for clearly licensing the blogpost, too.
This is absolutely amazing! I love it!